

MS Pro Briefing | 13th August 2025
Ponzi resemblance, Bond volatility, Bitcoin maturity, and more..

We are publishing this without a paywall. Please share widely.
MS Pro has a simple aim: to make your job easier. Our team combs through hundreds of academic and institutional reports every week. With MS Pro, we seek to simplify this into clear, concise, and actionable insights.
Actionable Insights
Some actively managed funds boost returns by buying illiquid stocks, creating a cycle called “Ponzi flows” that attracts more inflows. This cycle can lead to sharp losses when inflows slow down. ETFs that dramatically outperform during inflow surges often experience significant declines afterward.
The type of investment fund and its investors affect how corporate bond prices move. OEMFs can push bond prices down when many investors withdraw at once, forcing quick sales. ETFs can ease that pressure since shares trade on the market, but if mostly held by institutions, they might make prices more volatile.
Large institutions and ETFs trading near the market close create temporary price pressure that often causes stocks to reverse their earlier moves. This end-of-day reversal is driven by trading activity, not changes in fundamentals, and explains short-term price swings at the end of the day.
Bitcoin’s steady 31% gain in Q2 and its 53-day stretch above $100,000 show growing stability despite economic challenges. More companies adding Bitcoin to their treasuries suggest it’s being seen as a long-term asset. With supply still tight, any increase in demand could lead to quick price moves.
The first half of 2025 brought major shocks like DeepSeek-R1’s launch, new tariffs, and U.S. debt downgrade, but global markets stayed strong. Traditional strategies may no longer be effective, which makes private equity, inflation-linked credit, and real assets appealing alternatives. Including these options can help improve returns and build stronger portfolios in today’s market.
This isn’t a ponzi scheme… but it kind of feels like one
Some actively managed funds may be generating strong returns in ways that resemble the mechanics of a Ponzi scheme. The gains aren’t driven by improving fundamentals, but rather by the price pressure created by their own buying.
A lot of these funds hold large positions in illiquid stocks. When new money comes in, it’s used to buy more of those same stocks. That extra demand drives prices up, making the fund’s performance look even better.
As returns rise, more investors pile in. Their cash fuels more buying, prices climb further, and the cycle repeats. It creates a kind of feedback loop where money coming in creates the illusion of strong returns. The researchers call this cycle “Ponzi flows.”
Roughly 2 % of total daily fund flows, and between 8 to 12 % of flows into the most illiquid funds, can be linked to Ponzi flow behavior. In dollar terms, about $500 million in investor capital is effectively reshuffled each day due to the price impact caused by these flows.
Funds that rely heavily on this dynamic often suffer sharp losses once inflows slow down. Some have seen drawdowns of over 200%.
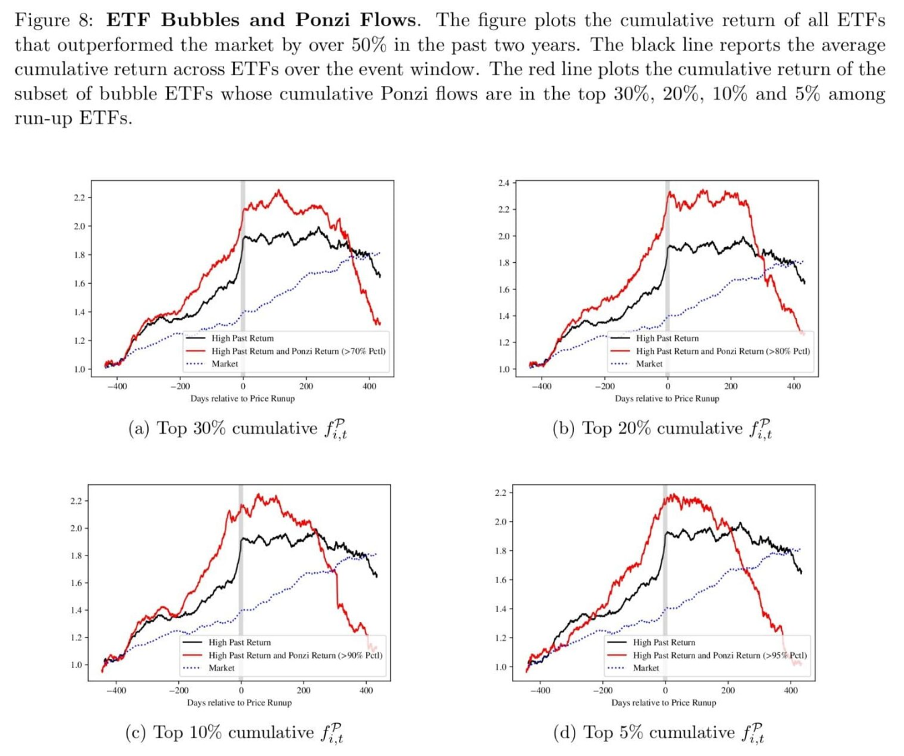
The chart above shows what typically happens. ETFs that dramatically outperform the market tend to collapse harder afterward. These “bubble ETFs” surge during the run-up phase but fall sharply once inflows slow.
While these funds may not meet the legal definition of a Ponzi scheme, the effect is similar.
Sources:
How to Identify Ponzi Funds? (Quantpedia, July’25)
Ponzi Funds (arXiv, May’24)
How ETFs and OEMFs influence bond volatility
Investment funds like exchange-traded funds (ETFs) and open-ended mutual funds (OEMFs) now play a major role in the U.S. corporate bond market. Together, they hold about 1 trillion dollars in corporate bonds, or roughly 12% of the total market. Even though both types of funds give people access to similar bonds, the way they work and who invests in them can affect how much bond prices move.
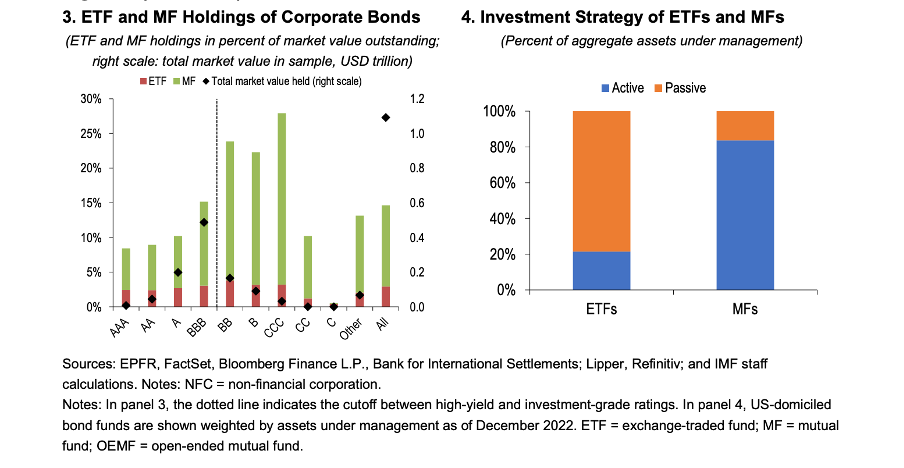
OEMFs allow investors to take out their money at any time at the fund’s current value. That might sound simple, but in stressful times it can create problems. If too many people pull out their money all at once, the fund might be forced to sell bonds quickly, even if the market is already falling. That can push prices down even further. This happened during the COVID-19 panic in early 2020, when many OEMFs saw large outflows.
ETFs work a little differently. Their shares are traded on the stock market, so investors can buy or sell without the fund having to touch the actual bonds it holds. This can help reduce the pressure on bond prices during rough patches. But the impact of ETFs also depends on who owns them.
Studies show that bonds with more ETF ownership, especially by retail investors, tend to have smaller price swings overall. But when those ETFs are mostly held by large institutions, the opposite can happen. Prices may become more volatile, especially in times of stress. Retail investors, on the other hand, seem to have a calming effect. This pattern doesn’t show up the same way with OEMFs, where the type of investor doesn’t seem to make much of a difference.
In the end, it’s not just about the fund itself. Who’s doing the investing can matter just as much when it comes to bond market ups and downs.
Source: Fund Investor Types and Bond Market Volatility (International Monetary Fund, March’25)
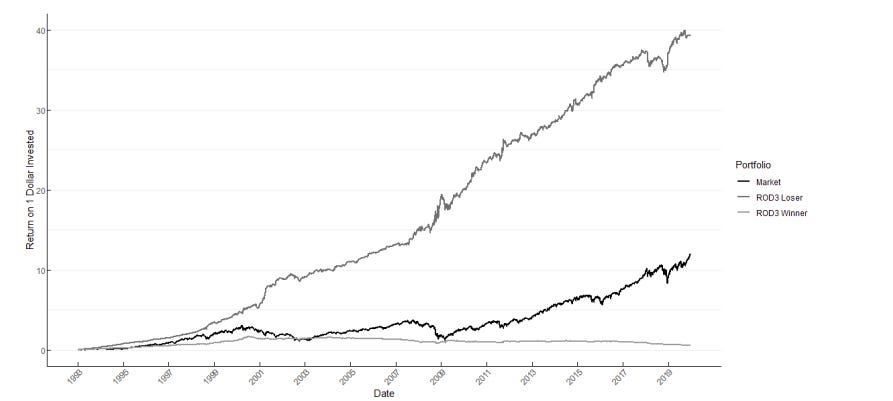
Think prices reflect the day’s news? Not always.
If you’ve ever noticed sharp moves in stock prices right before the market closes, you’re not alone. Research shows that in the last 30 minutes of trading, especially during the closing auction, stocks often experience temporary price pressure.
This pattern, called the “end-of-day reversal,” shows up consistently. It’s not driven by fundamentals, but rather by how large institutions and ETFs manage their trades. Many of these players aim to execute at the close to track indices or align with their net asset values. That end-of-day rush creates short-term distortions.
And the data backs it up. Looking at U.S. stocks from 1993 to 2019, researchers focused on names listed on the NYSE, AMEX, and NASDAQ, priced over $5, and excluded the smallest 10% by market cap. Every day, they ranked stocks based on returns from the previous close up to 3:00 p.m. (they called this ROD3). Then at 3:30 p.m., they grouped them into five portfolios and held them until the market closed at 4:00 p.m.
The pattern was clear: stocks that had underperformed earlier in the day (shown in dark grey) often bounced back by the close, while earlier winners (light grey) tended to fade. For context, the black line on the chart they used shows the full-day market return, sourced from Kenneth French’s data library.
Sources:
Why the Last Few Minutes of Trading Might Matter More Than You Think (alpha architect, July’25)
End-of-Day Reversal (SSRN, December’24)
From volatile to valuable: Bitcoin shows signs of maturing
Bitcoin’s Q2 performance wasn’t just strong. It was steady. After a slight pullback in Q1, the price jumped 31% over the second quarter, ending June at $108,375. But the real story wasn’t the gain itself. It was the fact that, by the end of June, Bitcoin had stayed above $100,000 for 53 consecutive days. For an asset known for its volatility, that kind of consistency was hard to ignore.
This stretch of stability came during a period that wasn’t exactly friendly to risk assets. There were rising tariffs, fears of stagflation, and a long list of geopolitical tensions. Yet Bitcoin held its ground. That raises a simple but important question: are investors starting to treat it differently?
There are some signs that point to yes. In Q2, several companies added Bitcoin to their corporate treasuries. It suggests a shift in perception, with more investors viewing Bitcoin as a long-term holding rather than a high-risk bet.
The price action told a similar story. In April, Bitcoin briefly entered a “death cross,” a historically bearish signal. But it reversed into a “golden cross” just 44 days later. That marked the shortest death cross period since 2015.
One metric that’s worth watching closely is the Illiquid Supply Shock Ratio. It gives a sense of how tight the market could get if demand starts to rise again. As of late June, it remained about 23% below its 2017 peak. That suggests the supply side is already tight. If demand picks up, the price could move fast.
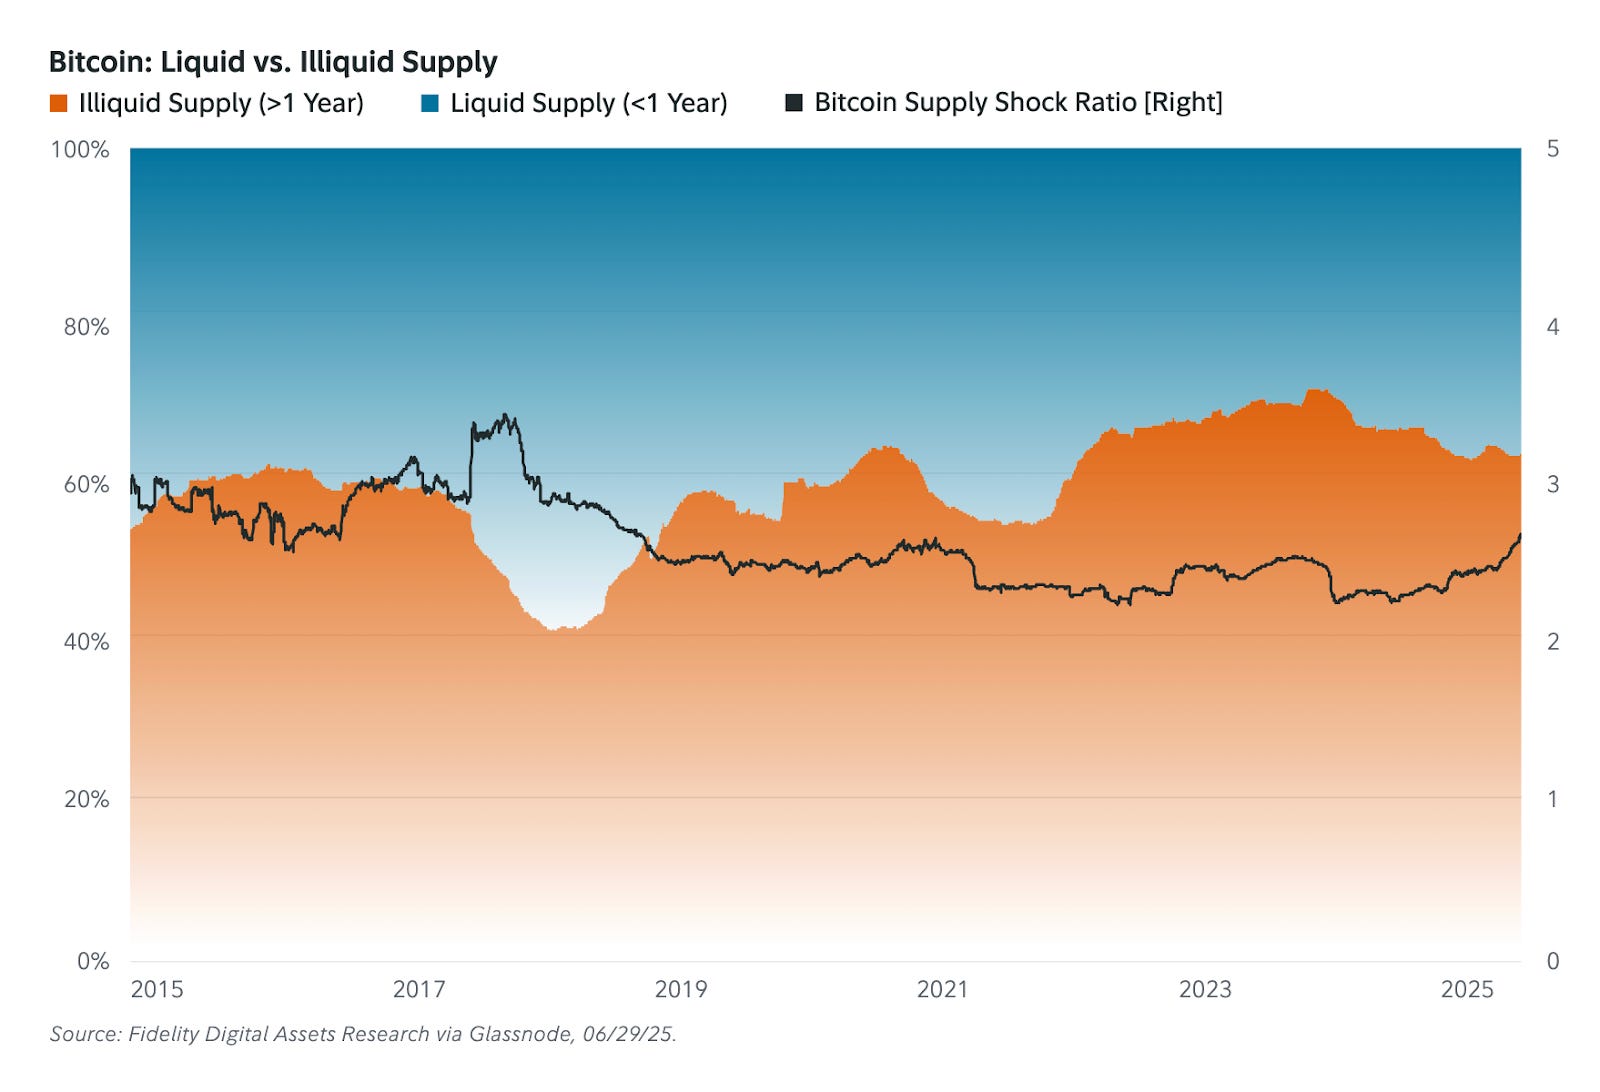
Taken together, these signs suggest the market is maturing. Bitcoin’s ability to hold up despite various headwinds hints that it’s starting to be seen more as a long-term investment than just a speculative trade.
Source: Signals Report (Fidelity Digital Assets, 2025)
Markets have changed. Shouldn’t your portfolio change too?
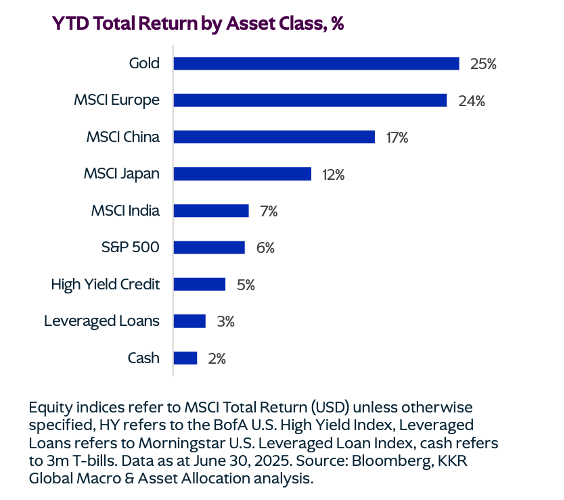
The first half of 2025 has brought a wave of global and economic shocks that continue to shape the market. In January, the launch of DeepSeek-R1 shook investor confidence, raising concerns about possible disruption to the dominance of the Mag7 tech giants. Then in April, President Trump announced tariffs on 60 countries. Just a month later, Moody’s downgraded U.S. government debt, something that has only happened once before since 1917.
Even with all these challenges, global markets, especially outside the U.S., have shown surprising strength this year.
But investors should not take this as a reason to relax. The days of steady returns supported by low interest rates and low market volatility, which lasted from 2015 to 2021, are now behind us. We are in a new environment shaped by higher nominal GDP, ongoing budget deficits, and rising global tensions.
In this new landscape, older investment strategies that worked after the 2008 financial crisis might not be as effective. Instead of relying on passive strategies that track the market, investors should now focus on long-term themes.
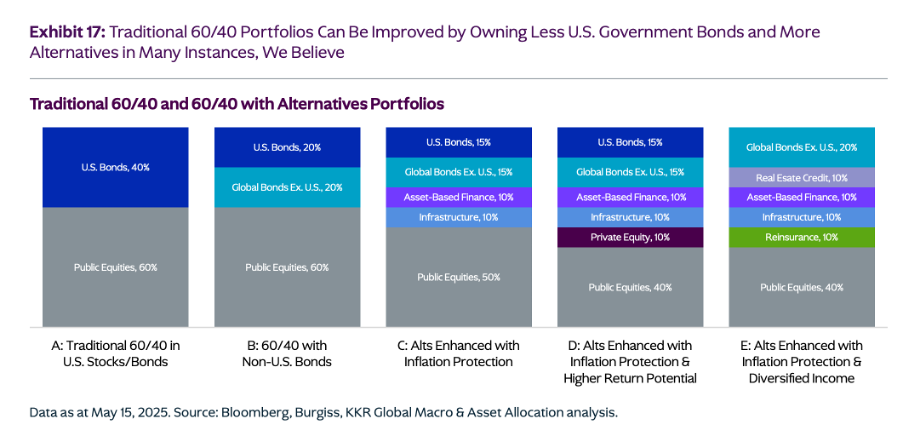
Some of the preferred investment areas today include control-oriented private equity, capital-safe segments of the credit market, and real assets that offer long-term contractual cash flows that can adjust with inflation. These kinds of investments can help diversify a portfolio, protect better against rising interest rates and market ups and downs, and also serve as stronger core holdings compared to traditional options like U.S. government bonds.
Shifting away from the conventional 60/40 portfolio and incorporating more alternatives can enhance returns and improve portfolio resilience in today’s market environment.
Source: Make your own luck - Mid-Year Outlook for 2025 (KKR, July’25)
Thanks for reading! As a Pro customer, you can add up to four teammates at no extra cost—simply reply to this email with their details.